At popular request, I’ve published a new set of voting charts for the Texas Supreme Court. These charts are tied directly to my court-tracking database, so they can be kept current.
If you just want a general sense of the voting dynamic, then the top-level percentage totals are what you need. But as an advocate, I want to know which types of cases and legal arguments led two Justices to disagree. To accomplish that goal, my system allows you to drill down and see the specific opinions that led to each set of agreements and disagreements.
As a bonus, this also makes my math transparent. By clicking through, you can see exactly which cases were rolled up to compute each percentage in the chart (and, I hope, will let me know if you see any data points that need to be adjusted).
How often do the Justices vote together?
The basic voting chart shows how often the justices on the Texas Supreme Court vote together.
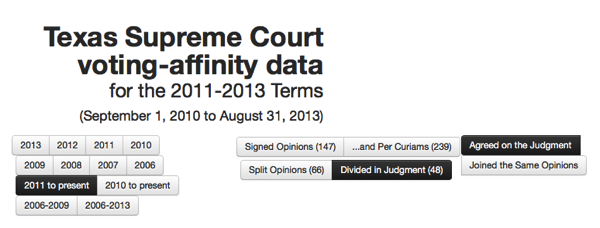
If you want to change the time period or focus of the chart, just pick one of the options at the top of the main page:

Those options show the pattern I look to most often: whether each pair of Justices agrees about the judgment in those cases where at least one Justice dissented.
Using that set of criteria, the pair of Justices with the closest voting record since September 2011 is Justice Johnson and Justice Wainwright at 84%. Focusing just on current Justices, (( The second- and third-closest pairs also involved Justices who have stepped down: the pair of Justice Wainwright and Justice Guzman was ranked second, and the pair of Justice Medina and Justice Lehrmann was in third. )) the closest pair is Justice Green and Justice Johnson at 70%.
Over the same time period, the pair of Justices who voted least often for the same judgment in divided cases was Justice Johnson and Justice Lehrmann, at 29%.
One of my favorite features of these charts is that you can click through to see a complete breakdown of how each individual pair of Justices voted — one a case-by-case basis:
From the detail pages, you can click on the words “Majority” or “Dissent” under each case to jump to the specific opinions about which they agreed or disagreed.
Who has written which opinions?
Each year, the OCA publishes a leaderboard of how many opinions each Justice has written, broken down by type of opinion.
I have a similar chart that shows the current count (through last week’s opinions): Texas Supreme Court opinions by Justice. You can click on the values in the chart to reach a backup page listing which specific opinions fall in each category. (( OCA does have one data set that outsiders don’t: knowing which per curiam opinions were penned by each Justice. For previous years, I have updated my chart to display the number of per curiam opinions that OCA has later reported were written by each Justice, but the backup pages don’t try to guess who wrote each of the per curiams. ))
So far, the 2013 Term has not been very contentious, with just 5 separate opinions in the partial term (just over seven months so far). By comparison, the full 2012 term had 26 separate opinions and the 2011 term had 45 separate opinions.
One factor, no doubt, is that the Court is still absorbing its two newest Justices. We’ll have to wait to see how the pattern plays out for the rest of the term. (These chart will continue to be updated as more opinions are released.)
Who has joined the opinions written by each Justice?
You can think of this third category of chart as a combination of the first two.
It shows how often each Justice joined the opinions written by each other Justice. Each row on the chart shows the opinions authored by a particular Justice. Reading across, you can see how many of the opinions were “solo” separate opinions and how many were joined by each of the other Justices with which they sat on that case.
Using the controls at the top of the chart, you can also narrow its focus just to dissents, just separate opinions (concurrences and dissents), or just deciding majority opinions.


